


Why Bottleneck Hunting Often Fails at the Diagnostic Stage
Many throughput problems are not caused by a single slow task. They emerge from the way demand, information, materials, capacity, queues, and decisions interact across the operation. Yet operational leaders often investigate these systemic problems with a micro-level tool, such as a detailed process flowchart. The result is usually a well-documented workstation surrounded by the same excess inventory, scheduling instability, and extended customer lead time that existed before the improvement project.
Value stream mapping and process flowcharts are frequently treated as interchangeable diagrams because both show how work moves. Their purposes are different, however. Value stream mapping examines the end-to-end value stream, including material flow, information flow, inventory, lead time, and customer demand. A process flowchart examines the logic and sequence of tasks within a defined activity, often at one workstation, department, or software interaction.
This distinction matters because a diagnostic mismatch consumes scarce improvement capacity without addressing the governing constraint. A team may remove seconds from a local task while the order waits days in a release queue. Conversely, a broad value stream map may identify a troubled department but fail to explain why operators repeatedly rework forms, encounter unclear decisions, or interpret standard work differently. The practical solution is to select the analytical lens according to the level at which the constraint exists.
Dissecting the Scope and Mechanics of Value Stream Mapping
Value stream mapping originated in the Toyota Production System as a way to represent the material and information flow required to move a product from order through delivery. The Lean Enterprise Institute explains value stream mapping as a view of every value-creating and non-value-creating action in the stream, rather than an isolated examination of machines or departments. This makes VSM particularly useful when delays cross functional boundaries.
A current-state VSM normally begins with a selected product family or service family and follows it door to door. The map captures process boxes, customer demand, supplier interactions, production control, scheduling signals, inventories, queues, and information exchanges. It also records operational data that allows the team to distinguish apparent activity from actual flow performance.
The timeline ladder is one of the most important features. It compares total lead time, which includes waiting and queue time, with value-added processing time, which is the time spent transforming the product or service in a way the customer values. A process may show several hours of hands-on work but several weeks of elapsed time. That gap is often the clearest evidence that the primary opportunity lies in flow, not labor speed.
- Cycle time shows how long a process takes to complete one unit.
- Changeover time indicates the time required to switch from one product or configuration to another.
- Uptime and availability reveal whether equipment reliability is restricting effective capacity.
- Work in Progress identifies buffers that may protect operations but also conceal demand and capacity problems.
- Quality and first-pass yield expose rework loops that extend lead time without creating customer value.
The map also makes overproduction and scheduling disconnection visible. If upstream processes produce according to local efficiency targets while the downstream customer requires a different mix or pace, inventory accumulates between the processes. The operational question becomes whether production is aligned to customer demand, often expressed through takt time, rather than whether every department appears busy.
When optimizing enterprise-wide delivery cadences, organizations often use a structured continuous improvement framework to expose systemic bottlenecks across disjointed departmental silos. The future-state map then translates those findings into a practical design, such as a pacemaker process, controlled supermarket, smaller work increments, leveled scheduling, or improved information flow.
Anatomy of a Process Flowchart and Micro-Level Task Friction
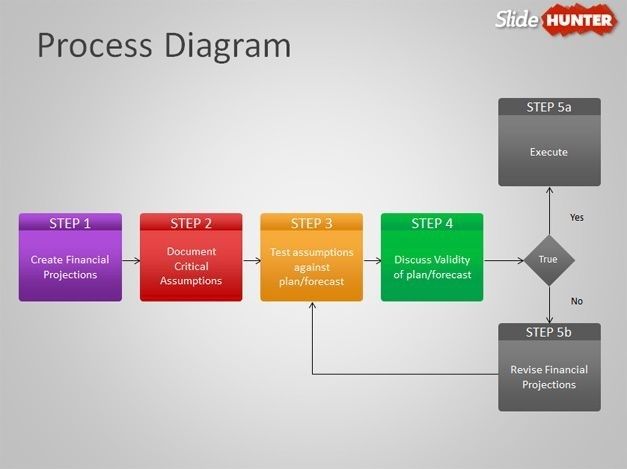
A standard process flowchart documents the chronological logic of an activity. It uses conventional symbols to distinguish process steps, decisions, inputs, outputs, and connectors. Directional arrows show sequence, while decision diamonds expose branches such as approvals, inspections, exceptions, or escalation paths. The basic architecture is intentionally straightforward, which makes it accessible to operators, supervisors, analysts, and software teams.
Flowcharts are most effective when the problem is contained within a defined boundary. That boundary might be a machine setup, a quality inspection, a maintenance request, an order-entry procedure, or a single interaction between an employee and an enterprise system. Swimlane flowcharts add responsibility by showing which role, department, or system performs each step. This is especially valuable when handoffs are unclear.
At this level, the diagnostic focus is procedural friction. A flowchart can reveal an approval loop that adds no control value, a duplicate data entry requirement, an ambiguous work instruction, or a decision that depends on undocumented operator judgment. It can also expose error traps, missing compliance evidence, and inconsistent responses to abnormal conditions.
- Ambiguous handoffs between operators, teams, or systems
- Repeated decision loops and unnecessary approvals
- Manual transcription that creates defects or delays
- Unclear regulatory documentation requirements
- Variation in task sequence or operator method
- Rework caused by incomplete inputs or poorly defined acceptance criteria
The limitation is equally important. A conventional process flowchart rarely shows supplier relationships, customer demand, inventory accumulation, production control, or the time spent waiting between departments. It may show that an order passes through five steps, but not that the order sits for three days between steps two and three. It can explain how work should proceed without proving how the entire value stream actually behaves.
For that reason, process mapping should not be judged as a smaller version of VSM. It answers a narrower question with greater precision. If the issue is inconsistent execution at a constrained station, a detailed flowchart is appropriate. If the issue is poor end-to-end delivery performance despite apparently efficient individual departments, the map is operating at the wrong structural tier.
Side by Side Comparison of Architectural Dimensions
The difference between the tools becomes clearer when their architectural dimensions are compared directly. VSM is a system-level instrument designed to connect customer demand with the full flow of material and information. A process flowchart is a task-level instrument designed to clarify sequence, responsibility, logic, and control within a defined process boundary.
This difference also determines who should participate. Executive leaders and value stream managers generally need the compressed, cross-functional perspective of VSM to prioritize investment and capacity decisions. Frontline teams, quality engineers, and supervisors often need the detailed visibility of a flowchart to redesign standard work, remove decision friction, and stabilize execution.
| Dimension | Value Stream Mapping | Process Flowchart |
|---|---|---|
| Primary scope | End-to-end product or service value stream | Defined task, workflow, station, or interaction |
| Typical boundary | Supplier or order entry through customer delivery | Start and end points within one process area |
| Flow represented | Material flow and information flow | Task sequence, decisions, inputs, outputs, and responsibility |
| Time data | Lead time, cycle time, waiting, changeover, uptime, and queues | Usually sequence-focused, with time added only where relevant |
| Inventory visibility | Explicitly records WIP, buffers, and accumulation points | Usually does not quantify inventory between steps |
| Diagnostic focus | Systemic waste, flow interruption, demand mismatch, and bottleneck location | Procedural friction, variation, rework, unclear decisions, and handoff defects |
| Primary users | Value stream leaders, operations directors, plant managers, and cross-functional teams | Supervisors, operators, quality teams, analysts, and process owners |
| Typical output | Future-state flow design and improvement implementation plan | Standardized workflow, revised procedure, or targeted corrective action |
Decision Framework to Match the Diagnostic Tool to the Constraint
The first decision is whether the symptom is systemic or localized. An immediate VSM engagement is warranted when customer lead time is increasing even though individual departments report high utilization, output, or schedule attainment. Other signals include growing WIP, frequent expediting, unstable delivery promises, large gaps between processing time and total elapsed time, and conflicting priorities between planning, production, purchasing, and distribution.
VSM is also appropriate when the location of the constraint is uncertain. If several departments blame one another, a cross-functional map creates a shared fact base. It can show whether the true constraint is a capacity-limited machine, an approval queue, a supplier lot-size policy, a planning rule, or an information delay. In healthcare and other high-variability environments, the framework may need adaptation rather than rigid application. Research on contextualized value stream mapping in healthcare highlights the need to account for variable demand, concurrent work, and professional judgment.
A granular process flowchart is the better starting point when the problem is clearly concentrated. Localized rework spikes, operator-to-operator variation, recurring documentation errors, unclear regulatory evidence, long approval loops, or inconsistent machine setup procedures all point toward process mapping. In these cases, the team needs to see the exact sequence, decision criteria, inputs, and ownership at the point of work.
- Choose VSM first when lead time, WIP, demand alignment, scheduling, or cross-functional handoffs are the dominant symptoms.
- Choose a process flowchart first when defects, rework, task variation, compliance gaps, or unclear decisions are localized.
- Use both when a systemic bottleneck has been identified but its local causes remain unclear.
- Delay mapping when the process family, customer requirement, or performance problem has not been defined.
Resources and time-to-insight also influence the choice. VSM requires cross-functional participation, direct observation, reliable data, and agreement on the product or service family. A flowchart can often be developed more quickly with a process owner and frontline team, although excessive detail can make it difficult to maintain. The best diagnostic plan balances urgency with the risk of solving the wrong problem.
Deploying a Two-Tier Diagnostic Strategy for Operational Excellence
A two-tier strategy prevents the common error of jumping directly into local optimization. The broad map establishes where the delivery system loses time and capacity. The detailed map then explains what happens inside the selected constraint. This sequence preserves the customer perspective while giving frontline teams enough resolution to redesign actual work.
- Execute a current-state VSM. Select a representative product or service family and map the flow from order or demand signal to delivery. Record actual lead time, processing time, WIP, cycle time, changeover, uptime, quality, and information signals. Use the map to isolate the primary bottleneck workstation, queue, or decision point along the critical delivery path.
- Zoom in with a detailed flowchart. At the isolated constraint, document the real sequence rather than the intended procedure. A swimlane chart can clarify ownership, while a decision flowchart can expose exception paths, repeated approvals, missing inputs, and rework loops. Compare operators, shifts, and product variants to identify process variation.
- Engineer the future-state VSM and revise standard work. Design the future-state flow around the actual constraint. Possible changes include workload leveling, smaller batches, clearer pull signals, reduced changeover, or a redesigned handoff. Update the local flowchart and standard work so that the new system design is executable at the point of work.
- Establish closed-loop metrics. Track macro outcomes such as total lead time, on-time delivery, WIP, throughput, and schedule stability alongside micro measures such as cycle-time variation, first-pass yield, rework, and adherence to standard work. A local improvement is not complete until it supports measurable value stream performance.
The sequence should be evidence-driven. Direct observation is essential because formal procedures often omit waiting, interruptions, workaround behavior, and informal communication. Data should be stratified by product family, shift, changeover condition, and abnormal event where possible. Otherwise, averages may hide the variation that creates the queue.
Governance is equally important. Assign a value stream owner for the end-to-end map and a process owner for the detailed workflow. Review performance at a cadence that matches the operating rhythm, using escalation rules when the constraint moves or when local gains fail to improve delivery. This prevents a completed diagram from becoming a static document rather than an operating control.
Transform Process Visibility into Measurable Flow
Operational breakthroughs rarely come from conducting more mapping workshops. They come from applying the right analytical lens to the actual failure mode. Value stream mapping sets the strategic throughput horizon by showing how demand, information, material, inventory, and capacity interact across the entire delivery system. Process flowcharts eliminate micro-level waste by making task logic, responsibility, variation, and decision friction visible where work is performed.
For immediate application, operational leaders can use the following checklist:
- Define the customer-facing problem in measurable terms, such as lead time, delivery reliability, defects, or throughput.
- Determine whether the symptom crosses departments or remains within one process boundary.
- Use VSM to locate systemic queues, WIP accumulation, demand mismatch, and the governing constraint.
- Use a process flowchart to investigate local rework, variation, handoff defects, and unclear decision logic.
- Link every proposed change to a baseline metric and a future-state target.
- Verify that local cycle-time gains improve total value stream performance rather than merely increasing upstream output.
The practical distinction is simple but powerful: use VSM to understand where flow breaks, and use process flowcharts to understand why work breaks at that point. Used together, the tools connect strategic diagnosis with disciplined execution, helping plant managers and continuous improvement teams convert process visibility into shorter lead times, more stable throughput, stronger quality, and sustainable operational control.